Overview
Want to improve your conversion rate but don’t know how to get started?
In this blueprint, we’ll show you how you can use ‘Google Optimize’, a free tool provided by Google, to improve your conversion rates.
You’ll also learn everything you need to know to set it up on your website, design your first experiment and analyze your results.
How Can You Use This?
- You’ll learn the basics of split testing your landing page.
- You can follow the steps in this blueprint to create your own A/B test using Google Optimize.
Tools And Resources
There are 2 main tools you’ll need to pick up to start doing your first split test:
- Google Analytics
- Google Optimize
If you have no idea how to set up your Google Analytics, we recommend you check out Google’s Analytics Academy.
https://analytics.google.com/analytics/academy/
We’ll run through how you can set up Google Optimize on your website in this blueprint. We’ll also cover how you can design and launch your first experiment.
As usual, you can download a PDF version of the blueprint here.
What You Need To Know?
Split testing is about conducting controlled experiments to improve a specific metric, such as leads or purchases.
When you conduct your split test for your landing page, you are sending traffic to an original landing page (which serves as a control) and different variations of the same landing page.
There are 2 ways to carry out split tests:
- A/B Testing – where you conduct a test based on one variable e.g. headline 1 versus headline 2
- Multivariate Testing – where you conduct tests based on more than one variable.
A/B testing is probably the most common way of running your test because it doesn’t require a large number of traffic.
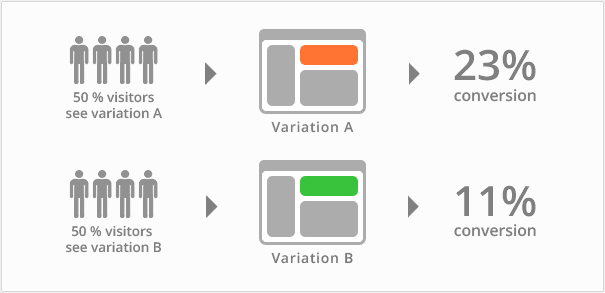
(Credit: VWO)
In this blueprint, we’ll teach you how to conduct a simple A/B test using Google Optimize (more about it later).
There are many things you can split test in a typical landing page like the one you see below:

But a general rule of thumb, you test things that make the biggest difference to your key metric e.g. conversion rate.
Here’s our list of things we usually test (in order of priority):
- Layout
- Headline
- Hero Shot
- Proof
- Credibility Builders e.g. media logos
- Benefit Bullets
- Call To Action
- Button Text & Colour
This is not a comprehensive list of variables you can test. But you can use this list as a starting point.
And depending on your landing page type, there might be other things you want to test. For example, if I’m sending traffic to a sales letter, I might want to test the following
- Delivery
- Video Sales Letter?
- Type Of VSL?
- Long Form Versus Short Form
- Pricing
- Price Packages
- Payment Options
- Risk Reversals
- Type Of Proof
- Urgency / Scarcity
When it comes to split testing, it’s important to take note of statistical significance – the degree in which a result is likely to have occured by chance.
When we say that a result has a high level of statistical significance, it means that the result is unlikely to have occured by chance.
To demonstrate this, consider the results in the table below:

However, when you look closer, you’ll realize the ‘sample size” for variant 1 is too small for the result to be statistically significant.If we look at conversion rate (%) alone, it seems that variant 1 is doing better than the original.
We’ll share more about statistical significance in future blueprints but the general rule of thumb when it comes to split testing is as follow:
- Make sure you test one variable at a time (at least for A/B testing)
- Make sure you run the test at the same period of time to account
- Make sure the sample size is large enough (the bigger the better)
- Make sure the sample for the original and variant is selected randomly
Google Optimize is a tool provided by Google to help you conduct experiments on your website.
(Credit: Google Optimize)
There are 2 versions – free and paid (also called Optimize 360).
The free version will give you the ability to do up to 5 simultaneous experiments and 16 combinations if you’re doing multivariate testing.
The paid version, however, allows you to run more experiments and provide much more customization. That said, it can be expensive to use the paid version.
So here’s our recommendation…
Start the free version if this is your first time doing conversion rate optimization (CRO).
And as you progress, you should look at tools such as Visual Website Optimizer (VWO) or UnBounce. They provide more features for a more affordable price.
How To Create Your First Split Test On Google Optimize?
The first step is to go to this link to register for your free account:
https://www.google.com/analytics/optimize/
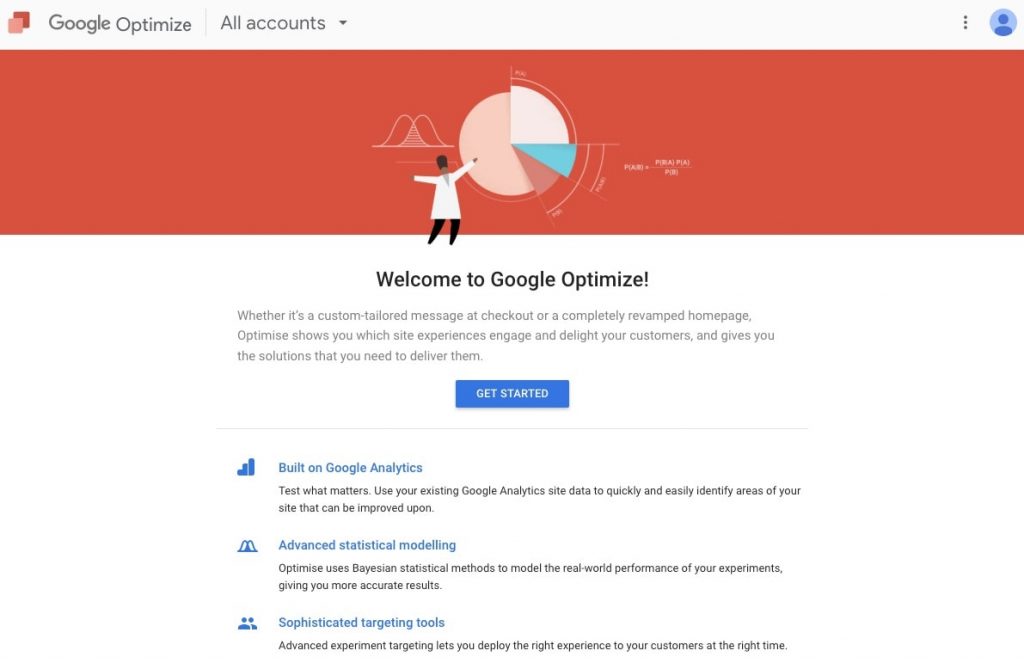
If you have an existing Google Analytics account, we recommend you create a Google Analytics Suite account and register for the various analytics services:
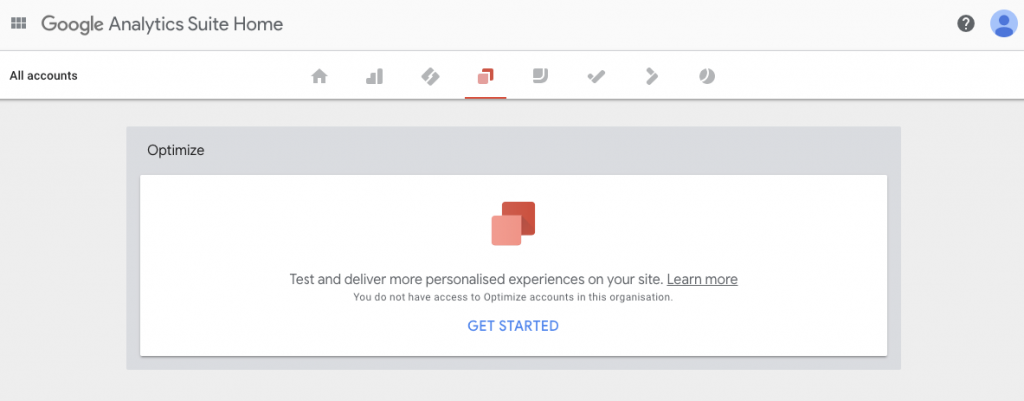
You’ll be able to get access to a wide variety of tools you can use to dramatically improve your marketing performance, such as:
- Google Tag Manager (GTM)
- Google Data Studio
- Google Surveys
- Google Attribution
- Google Audience Center
We’ll share more about the other tools in future blueprints, especially Google Tag Manager.
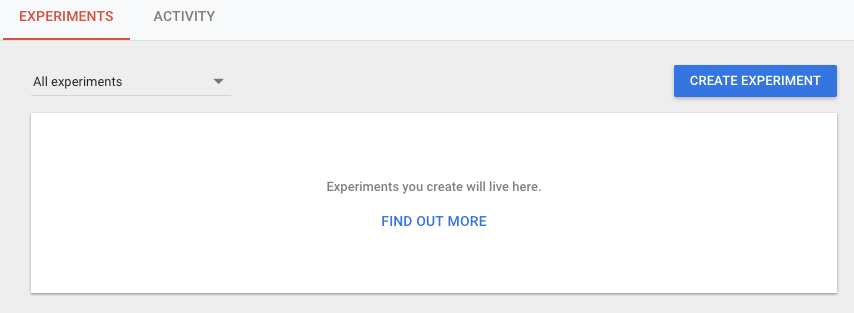
Once you’ve registered for your account, you can proceed to create your first experiment. Click on “Create Experiment”.
You can give a name for the experiment. Be as explicit as possible.
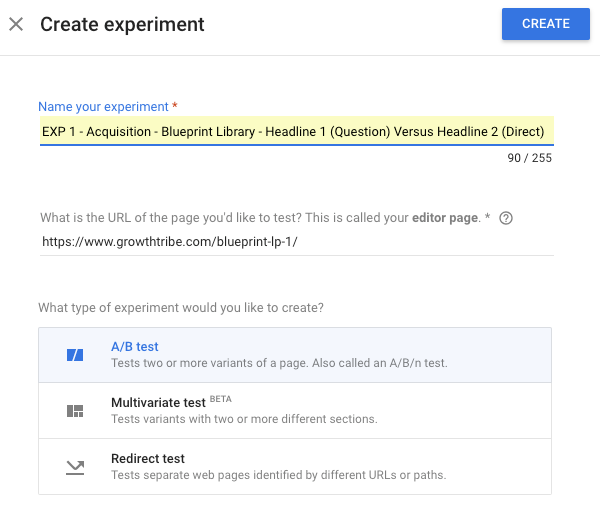
There are 3 types of tests you can run and you can read more about them here:
https://support.google.com/optimize/answer/7012154?hl=en
For the purpose of this blueprint, we’ll focus on creating a simple A/B test.
Click on the “Create Variant” button and name the variant.
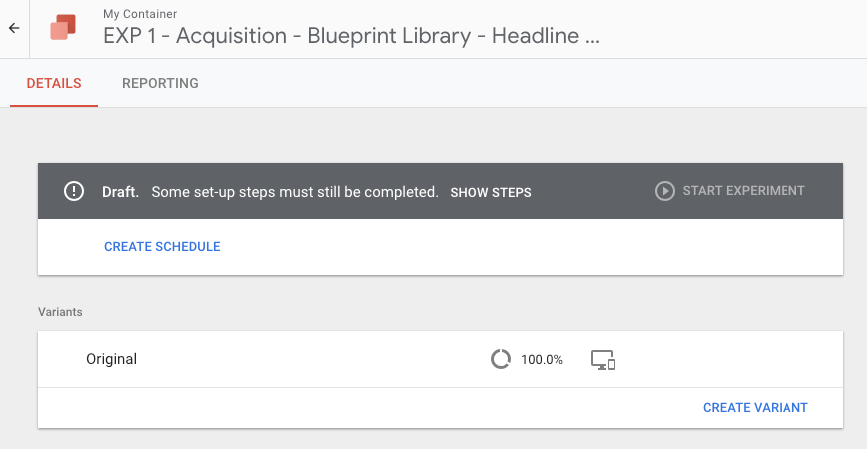
Once your variant is created, you can roll over on the variant and click “Go to editor”.

The great thing about Google Optimize is that you can make simple edits to your landing page with the editor, even if you don’t know a thing about creating or editing web pages.
If you need more complicated changes, you will probably need to seek the help of an experienced web developer or learn some basic HTML.
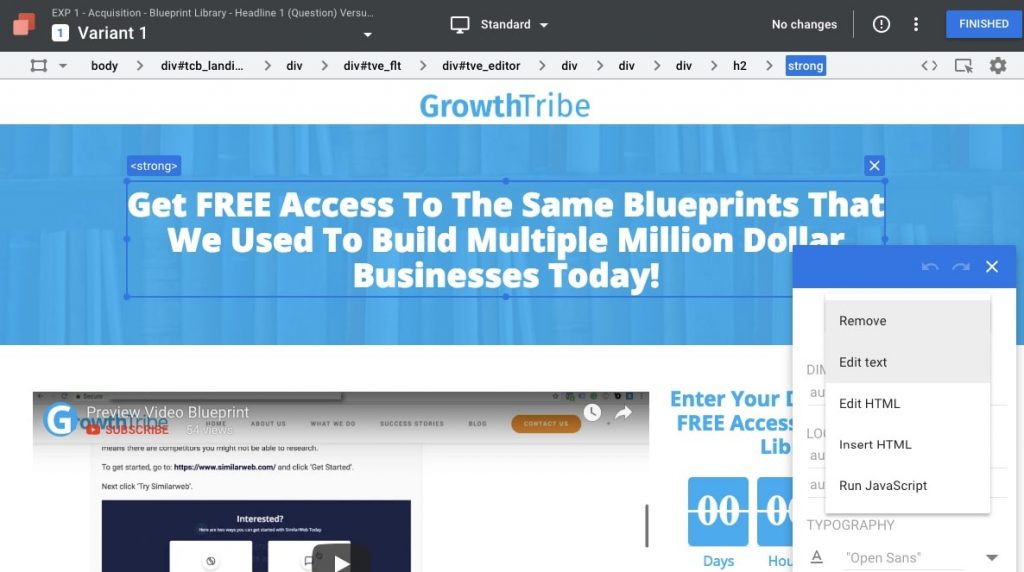
Once you’re done, click on “Finished” to go back to your experiment dashboard.
You can select different objectives based on your experiment design. In our case, we select “Choose from list”.

While you can choose from a list of objectives linked to your Google Analytics, we recommend you use a “custom objective” for now.
You can either use “Page Views” and track the number of views on your “Thank You Page”.
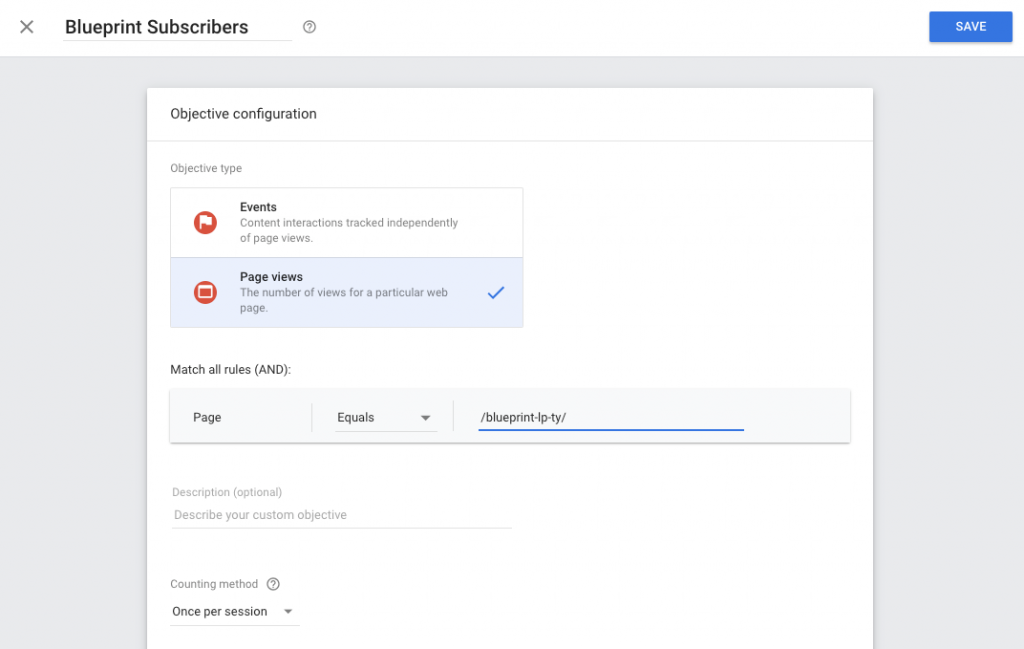
You can fill in your description and hypothesis to keep track of the objective of your campaign.

To install your script to your website, you can click on the “Add Optimize To Your Website” option and follow the instructions.
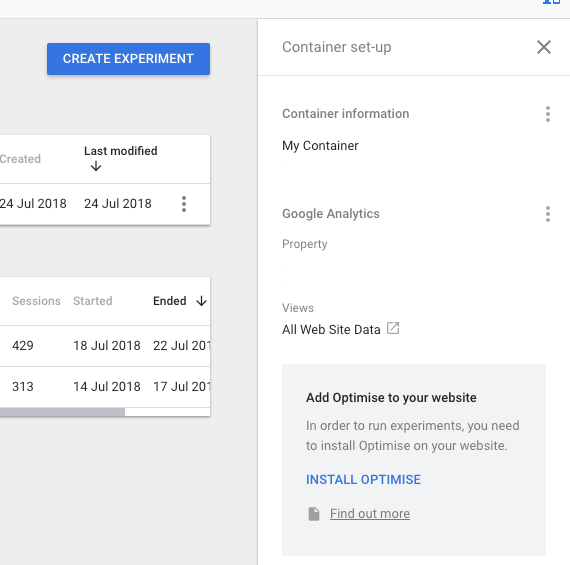
In general, you need to modify the Google Analytics tracking code and add the code to the ‘
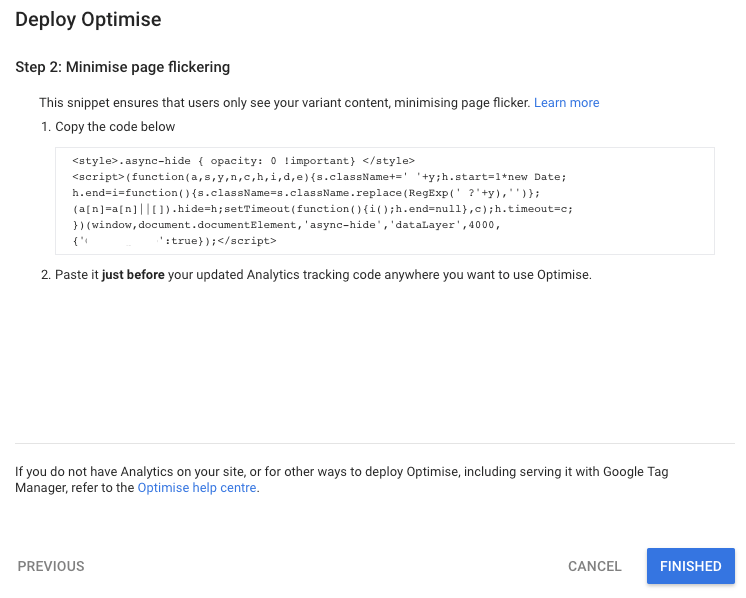 You’ll need to add this code before the Google Analytics code.
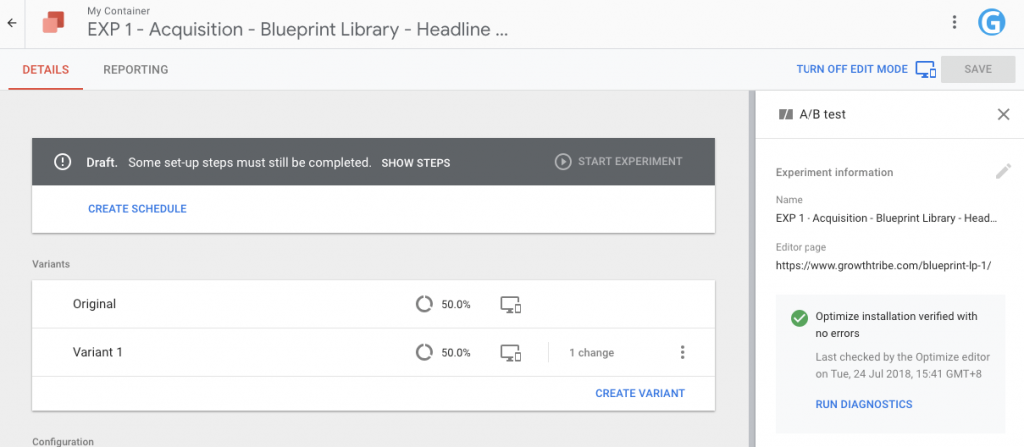
We recommend you do a diagnostic on your landing page before you start your experiment.
You can click on “Run Diagnostic” and they will do a quick test on your website. If there are no errors, you’ll see the message with a green tick.
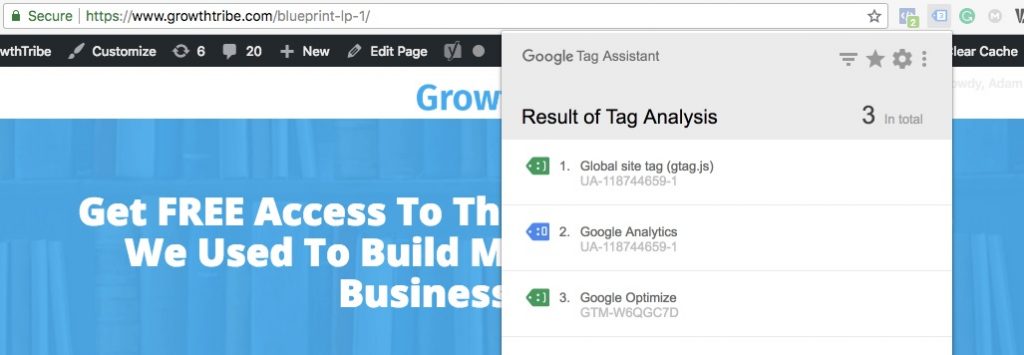
We also recommend you use a Chrome extension called “Google Tag Assistant” to check if your code is triggered properly.
You should see the result below if everything is implemented properly.
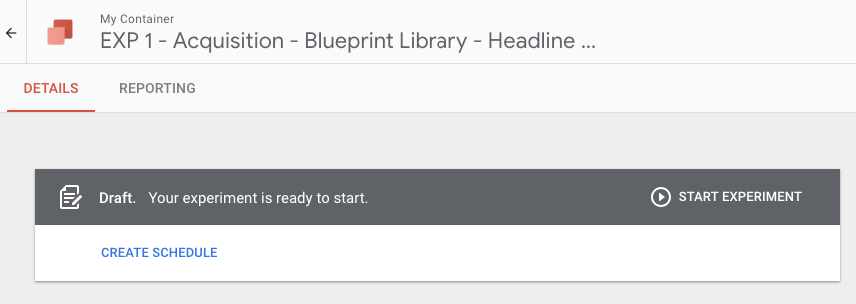
When you are ready, click on ‘Start Experiment’.
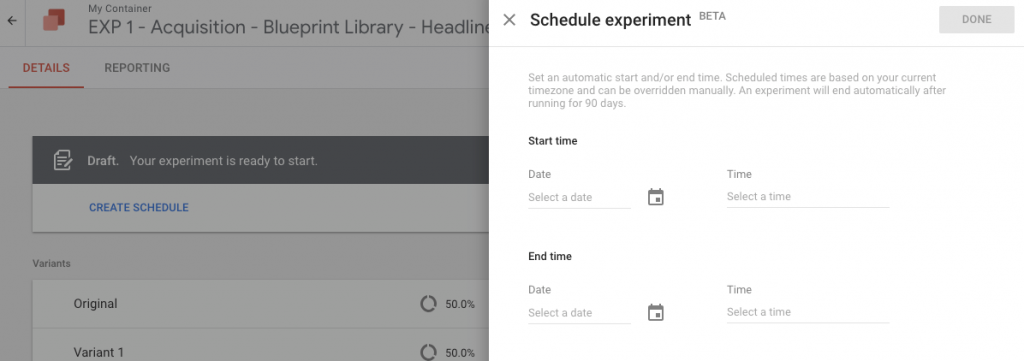
Alternatively, you can schedule the experiment to run between specific dates and times.
We recommend you check your experiment on a daily basis. If there are mistakes in the implementation, you’ll notice that there are no results recorded.
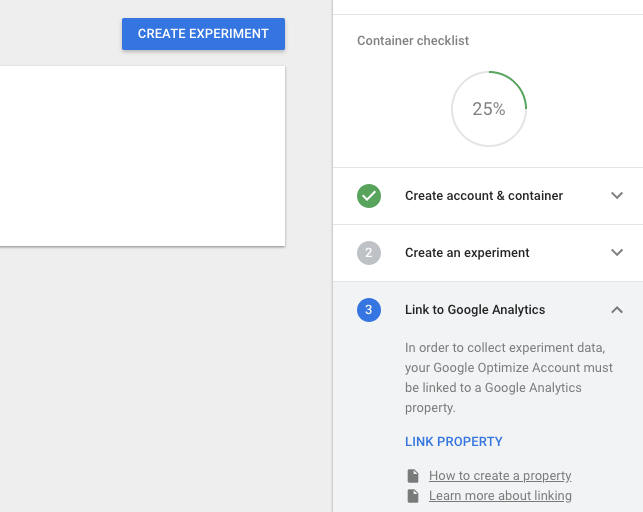
You’ll have to link up your Google Optimize account to your Google Analytics. You can learn more about the linking process here:
https://support.google.com/optimize/answer/7008374?authuser=1
I highly recommend you setup your accounts under the same organization in Google Analytics Suite. This will help to simplify and speed up the linking process.
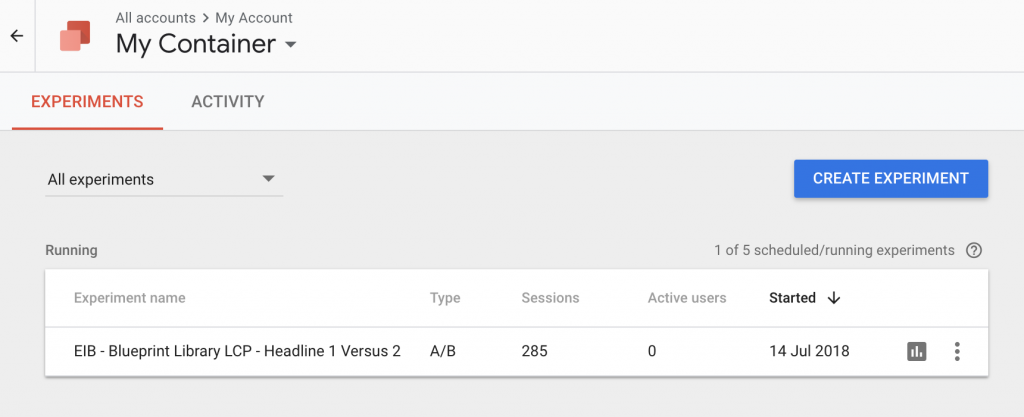
You can review the results of your experiment as it is running.
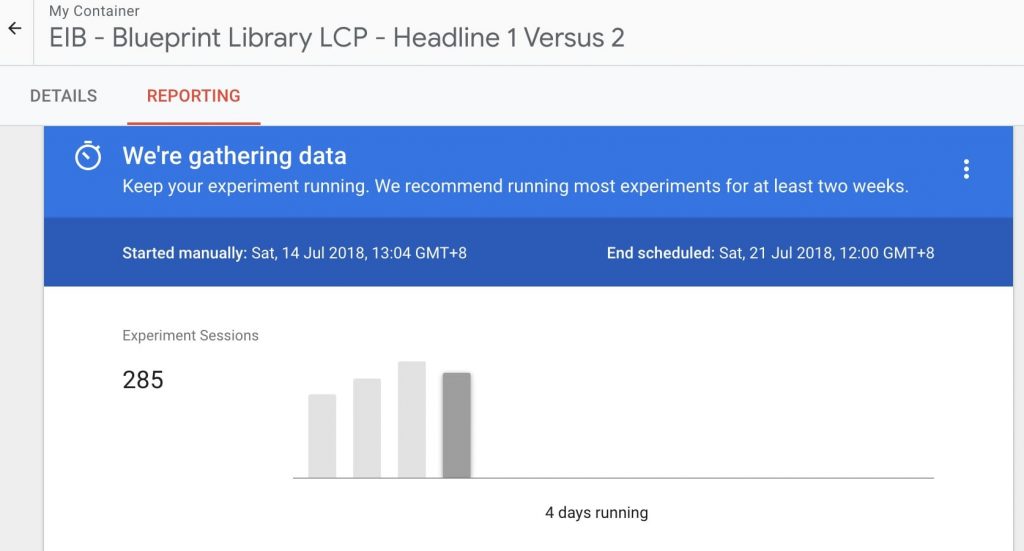
However, I recommend you only make conclusions from your results 2 weeks into your experiment.
You can select the experiment you want to look at first.
Click on ‘Reporting’ and you’ll see the dashboard below.
You’ll notice that in this case, the variant (with a different headline) seems to be doing much better than the original.
In fact, based on the report, there is up to 98% improvement in the conversion rate with a high probability of beating the baseline.

If this result holds up, we can change the headline of the original to the new one.
What’s Next?
This blueprint has given you a great overview of how you can set up your own experiment on Google Optimize.
I recommend you take some time to explore the other tools in Google Optimize. You’ll find a whole suite of powerful resources you can use to improve your current marketing campaign performance.
If you’re running traffic to a lead capture page, do check out our ‘How To Craft A High Converting Lead Capture Page’ blueprint on improving your page’s performance.
You can find new ways to improve your landing page performance using our ‘Fix Your Campaign’ blueprint.
